
Maintaining high quality in products and services is essential for business success. One of the most effective ways to achieve this is through the use of quality control tools. These tools help identify problems, monitor processes, and implement improvements that lead to consistent and reliable outcomes.
What Are Quality Control Tools?
Quality control tools are structured techniques used to measure, analyze, and improve processes. They help teams find the root causes of issues, reduce variations, and ensure that the final output meets quality standards.
Industries ranging from manufacturing to healthcare rely on Quality Control Tools to maintain control over production and service delivery. These tools help turn raw data into insights that can guide better decision-making and improve overall performance.
Why Quality Control Tools Are Important
Using Quality Control Tools allows organizations to detect defects early, minimize waste, and improve customer satisfaction. These tools promote a proactive approach to quality by enabling teams to address problems before they affect the end product or service.
They also support continuous improvement, which is key for businesses looking to remain competitive, compliant, and efficient over time.
The Seven Essential Quality Control Tools
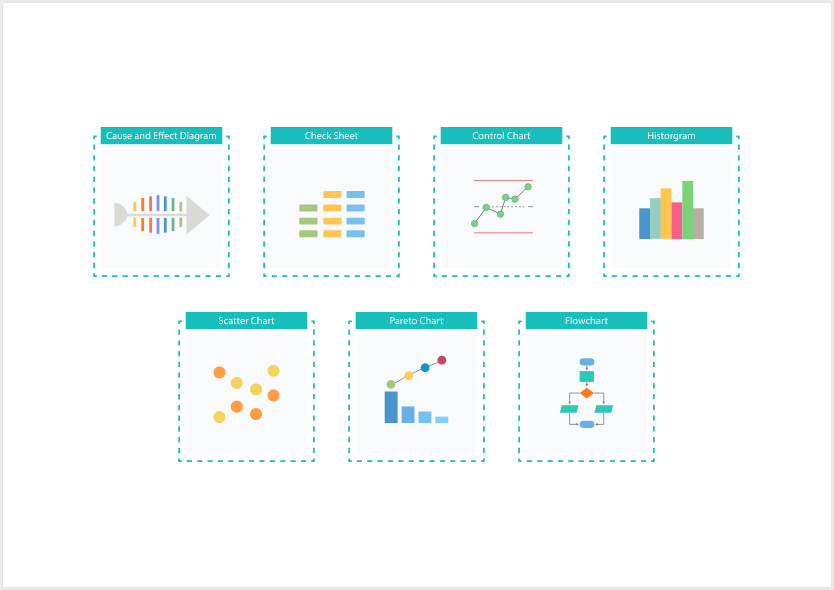
These seven tools are commonly used in quality management and process improvement:
- Cause-and-Effect Diagram (Ishikawa/Fishbone)
Helps identify and categorize potential causes of a problem to find the root cause. - Check Sheet
A simple method for collecting and organizing data in real time for analysis. - Control Chart
Monitors process performance over time and detects variations from expected behavior. - Histogram
A bar graph that shows the distribution of data to identify patterns or inconsistencies. - Pareto Chart
Prioritizes problems by their impact using the 80/20 principle to focus on the most significant issues. - Scatter Diagram
Plots two variables to determine if a relationship or correlation exists between them. - Flow Chart
Visually represents each step in a process to uncover delays, redundancies, or inefficiencies.
How to Use Quality Control Tools Effectively
- Define the problem or quality objective clearly
- Choose the right tool based on the type of issue and data available
- Gather accurate, relevant data from reliable sources
- Collaborate with team members for deeper analysis and creative solutions
- Implement improvements and monitor results regularly
Conclusion
Quality control tools are vital resources for organizations striving to achieve high performance and customer satisfaction. They help streamline processes, reduce errors, and ensure products or services consistently meet expectations. By integrating these tools into your daily operations, your business can foster a culture of quality, efficiency, and continuous improvement.